Broker's Opinion of Value
311 S New Hampshire
Los Angeles, CA 90020
16Units
11,792Square Feet
1989Year Built
9,015SF Lot
Filip Niculete
Filip Niculete
Senior Managing Director Investments
Glen Scher
Glen Scher
Senior Managing Director Investments

Prepared Exclusively for Parallax Properties LLC

September 2026

Team Track Record
Current Results, Local Market Experience, and Senior-Level Execution
LAAA Team | Marcus & MillichapLocal market knowledge. National reach. Senior-level execution.
494Closed Transactions
342Apartment Sales
11Within 3 miles
$1.56BTotal Sales Volume

Representative Local Closings

AddressUnitsSale Price$/UnitDistanceClosed
819 Beacon Ave15$1,925,000$128,3331.58 mi2025
1186 North New Hampshire Avenue6$1,685,000$280,8331.69 mi2020
5330 Loma Linda Avenue8$4,400,000$550,0002.46 mi2021
96.7%Apartment Pricing Accuracy
34Median Days on Market, Apartments

Published team performance, laaa.com/track-record, as of September 8, 2026.

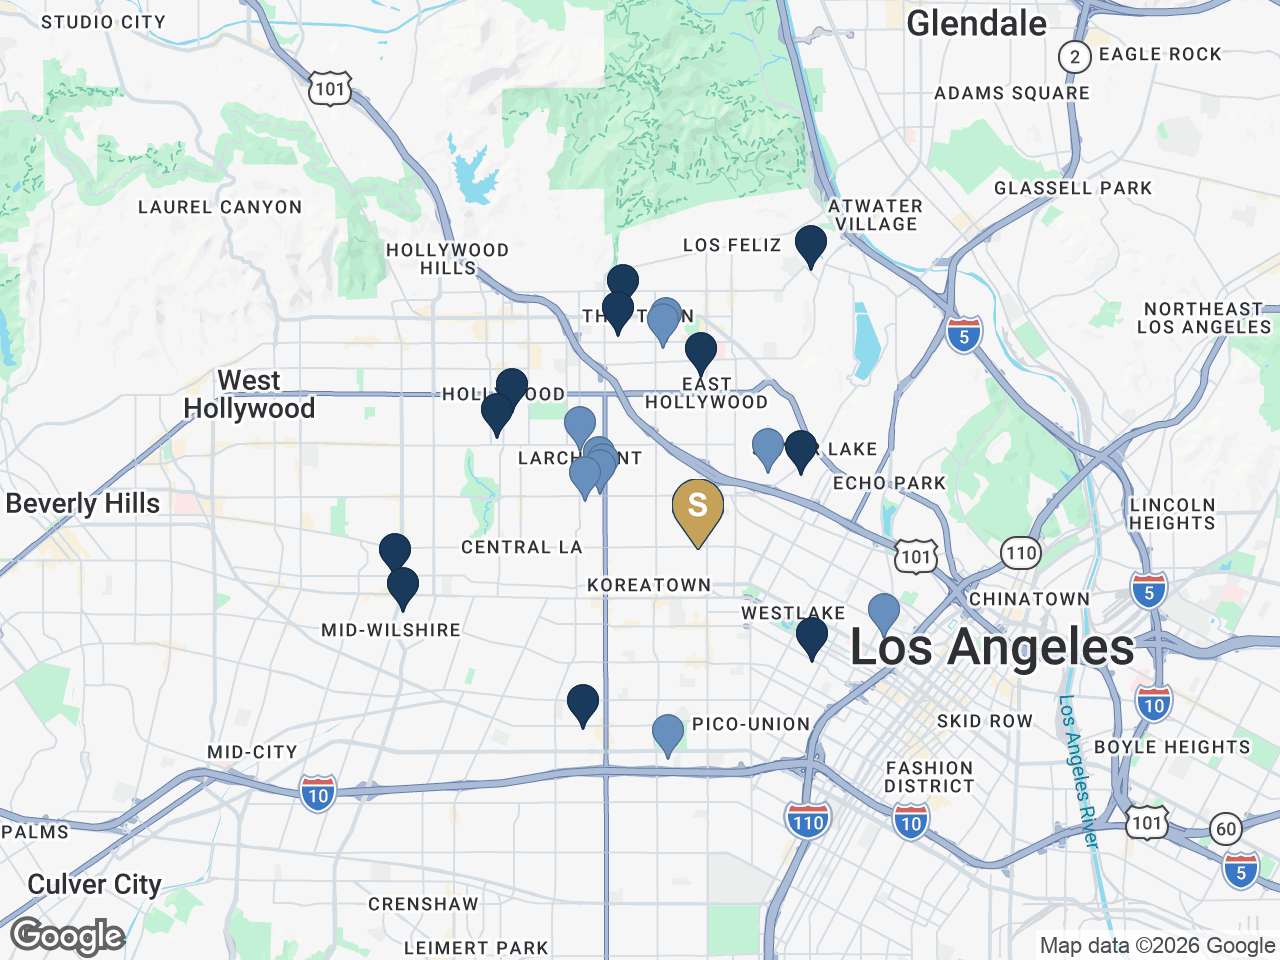
LAAA closings near 311 S New Hampshire

311 S New Hampshire is the gold marker. Navy markers are the 11 apartment buildings the LAAA Team has closed within 3 miles; lighter markers are 10 other LAAA closings in the same area. Source: laaa.com/track-record, as of September 4, 2026.

A Track Record Built One Assignment at a Time

This building has been on the market with three brokerages since December 2024 and has not sold. That is not a pricing problem alone; it is a buyer-list problem. The buyer for a 1989 non-rent-controlled sixteen-unit building in Koreatown is somebody who already owns this vintage, knows what AB 1482 does and does not allow, and can read a rent roll with three vacancies and a water bill without flinching. That buyer is on a list, not on a portal, and the list is what 494 closings and $1.56B in volume across 21 states and Washington, D.C. have built.

The Team Behind the Assignment
Filip Niculete
Principal
Filip Niculete
Senior Managing Director Investments
Filip Niculete advises multifamily owners and investors throughout Southern California with an emphasis on disciplined marketing and execution.
Glen Scher
Principal
Glen Scher
Senior Managing Director Investments
Glen Scher advises apartment owners and investors across Southern California with a focus on evidence-based pricing and transaction execution.
Aida Memary Scher
Aida Memary Scher
Associate Director Investments
Morgan Wetmore
Morgan Wetmore
Associate, Investments
Logan Ward
Logan Ward
Associate, Investments
Luka Leader
Luka Leader
Associate, Investments
Alexandro Tapia
Alexandro Tapia
Associate, Investments
Blake Lewitt
Blake Lewitt
Associate, Investments
Mike Palade
Mike Palade
Agent Assistant
Tony H. Dang
Tony H. Dang
Business Operations Manager
Tirajeh Vossoughi-Horton
Investment Brokerage Intern
How We Market Your Property
Position the Story, Reach the Market, and Work the Buyer List
23,500+Active Email Subscribers
36,000+Owner & Investor Contacts
60,000+Buildings Tracked
100+Targeted Buyer Calls

Our public, continuously maintained reach combines active email subscribers, owner and investor contacts, a building-owner database, and targeted direct buyer calls for each listing.

The objective is not simply exposure. It is qualified competition for your property.

The Campaign Plan

01

Direct Owner and Investor Outreach

The campaign opens with calls. We start with the owners of every 1980s and 1990s apartment building in Koreatown, Mid-Wilshire and East Hollywood, the buyers who bid on the 2025 and 2026 sales at 534 S Oxford, 843 S Ardmore, 542 N Normandie and 976 Elden and did not win them, and the 1031 exchange buyers selling rent-controlled buildings who need a replacement without the RSO. A building that has already been seen by the portal audience needs a fresh audience, and the first two weeks are spent finding it rather than waiting for it.

02

Full Platform Syndication

Every LAAA listing is advertised across the same ten platforms: TheMLS, CoStar and LoopNet, Crexi, Brevitas, Zillow, Redfin, ApartmentBuildings.com, DuxRE, MarcusMillichap.com and laaa.com. Syndication is source-stamped so we can tell you which platform produced each inquiry rather than reporting undifferentiated view counts.

03

Email Campaign and Reach

The property goes out to 23500 active email subscribers across an owner and investor database of 23500 contacts, then to targeted re-sends built from who opened and who did not. Campaign statistics are reported to you in full, including the misses.

04

Marcus & Millichap Agent Network

Marcus & Millichap's national agent network puts the listing in front of brokers whose own clients are looking for Los Angeles County multifamily, which reaches capital that never searches a listing portal at all.

Built In-House Buyer Research

Our team built the 16-database research system that develops a property-specific buyer list from ownership, acquisition, financing, and portfolio signals.

Direct Calls, Not Passive Exposure

We call the owners and investors most likely to act instead of relying on digital distribution alone.

Weekly Seller Intelligence

Calls, tours, buyer feedback, and offer activity are organized into a clear weekly campaign update.

We are proactive marketers rather than reactive ones. The offering is built, priced and staged before it is released, the outreach runs on a schedule you can see, and you get a written report on what happened rather than a summary of what we hoped would happen.

Our Active Multifamily Listings
Current LAAA Team Multifamily Availabilities and Escrows
AddressCityUnitsAsking Price$/UnitCapStatus
13724 Victory BlvdVan Nuys68$22,900,000$336,7655.50%Available
10455 Magnolia BlvdNorth Hollywood26$9,200,000$353,8465.03%Available
180 Holly AvenueCarpinteria19$8,950,000$471,0534.80%Available
2727 3rd StreetSanta Monica22$7,650,000$347,7275.16%Available
31701 Ridge Route RdCastaic33$7,500,000$227,2735.64%Available
3607 Pacific AveMarina del Rey6$5,395,000$899,1674.75%Available
2001-2005 Grismer AvenueBurbank14$5,350,000$382,1434.56%Available
755 E Pine StreetAltadena19$5,195,000$273,4216.68%Available
7018 Alabama AveCanoga Park9$5,100,000$566,6675.27%Available
4603 La Mirada Avenue & 1255 Lyman PlaceLos Angeles9$4,450,000$494,4445.28%Available
24846 Walnut StSanta Clarita16$4,200,000$262,5005.13%Available
12314 & 12320 Washington PlCulver City8$3,096,000$387,0005.00%Available
11025 Blix StToluca Lake4$2,700,000$675,0005.27%Available
1303-1305 Laveta TerraceLos Angeles10$2,590,000$259,0004.24%Available
1807 Montana StreetLos Angeles4$2,395,000$598,7505.84%Available
12231 Pacific AveLos Angeles7$1,900,000$271,4295.02%Available
5614 W Adams BlvdLos Angeles7$1,795,000$256,4296.52%Available
24513-24519 Walnut StSanta Clarita3$1,095,000$365,0004.31%Available
20234 Roscoe BlvdWinnetka25$4,750,000$190,0005.51%In Escrow
3361 Hamilton WayLos Angeles4$2,800,000$700,0005.62%In Escrow
24802 & 24806 Walnut StSanta Clarita7$1,725,000$246,4295.31%In Escrow
Total (21 listings)320$110,736,000$346,0505.27%

The LAAA Team is currently marketing 18 multifamily listings with 3 more in escrow, together representing 320 units and $110.7M of asking value. Every assignment runs on the same marketing platform proposed for 311 S New Hampshire.

Listings and statuses as published at www.laaa.com/listings; pricing and status are subject to change. The summary row shows total units and total asking value, the blended price per unit across all listings, and the median published cap rate.

Buyer Profile & Transaction Strategy
Who Is Most Likely to Buy, and How We Create Competition

Market Context

Seven closed sales of 1988 to 1991 apartment buildings within a mile and a half of the subject recorded between February 2025 and May 2026. They closed at $2,300,000 to $5,041,000, $225,000 to $270,000 per unit and $256 to $424 per SF. The nearest and largest, 534 S Oxford Ave, a 21-unit 1989 building five blocks west, recorded at $5,041,000 in August 2025 ($240,048 per unit, $341 per SF); the most recent, 542 N Normandie Ave, twelve 2 bed / 2 bath units of 1988 vintage, recorded at $3,000,000 in March 2026 after listing at $3,550,000.

The pattern across the set is the same: every listed building closed below its ask, by 5.6% to 17.9%, after 57 to 321 days. The subject has lived that pattern itself, listed by KW Commercial in December 2024, by the Ghobaditey Team in April 2025 at a 5.83% cap, and by RE/MAX from March 2026 at $3,925,000, each without a sale. The one active same-vintage listing, 810 S Berendo, asks $264,706 per unit and $353 per SF at 5.26% on in-place rents and has been on the market a month. The subject at $3.85M is $240,625 per unit and $326 per SF, below that ask on both measures and inside the closed range on both.

Positioning Thesis

The right buyer values what is scarce here: a Koreatown building outside the RSO with a 6.5% going-in yield on real 2025 expenses and eight long-term tenancies that reset to market on turnover. That buyer should be qualified early on two questions, whether they will underwrite the three vacancies at ownership's projected rents or at collections, and whether they will re-trade after inspection of the eleven original interiors, because both decide whether an offer survives to closing.

Likely Buyer Profiles

Likely Buyer 01

Koreatown Post-1978 Owner

Owners who already hold 1980s and 1990s buildings in Koreatown, Mid-Wilshire and East Hollywood, including the buyers on the Oxford, Ardmore, Normandie and Elden sales. They know the product, the tenant base and the AB 1482 arithmetic, and they buy on price per unit and yield rather than on a pro forma.

Likely Buyer 02

1031 Exchange Buyer Leaving Rent Control

Sellers of older rent-controlled buildings in the City of Los Angeles trading into exchange replacement property. A 1989 certificate of occupancy with no RSO is exactly the asset that pool is looking for, and a 45-day identification clock makes them decisive.

Likely Buyer 03

Yield Buyer With a Renovation Plan

Operators who will pay for a 6.5% going-in yield and finish the remodel program across the eleven original interiors as tenancies turn, lifting the one bedrooms toward $1,900 and the two bedrooms toward $2,400 without a rent-control ceiling on the vacant units.

Transaction Strategy

01

Relaunch Inside the Evidence, Not Above It

Every 1988 to 1991 building that closed near the subject in the last eighteen months sold below its asking price, by 5.6% to 17.9%, and the subject's own $3,925,000 ask produced no sale in six months. A relaunch at the same number invites the same result. Pricing at $3.85M, inside the $225,000 to $270,000 per unit closed range and below the one active same-vintage ask, gives the campaign a number a buyer can underwrite to on day one rather than a number they have already passed on.

02

Lead With the 1989 Certificate of Occupancy

Most Koreatown multifamily asks a buyer to inherit the Rent Stabilization Ordinance. This one does not. A 1989 certificate of occupancy puts the property outside the City's RSO; the statewide AB 1482 cap of 5% plus CPI still applies to occupied units, but every lease resets to market on turnover, and eight of the sixteen tenancies date from 2008 to 2017. The campaign should say so in its first line.

03

Put the Real Statement in the Package

The prior offering carried broker-estimated expenses and other income with nothing behind them, and buyers discounted what they could not verify. This time the package carries ownership's own rent roll and two years of operating statements, with the water bill, the repairs and the three vacancies in plain sight. A buyer who is handed the statement underwrites once and does not re-trade; a buyer who finds a gap in diligence does.

Investment Overview
311 S New Hampshire Avenue, Los Angeles, CA 90020
16Units
11,792Building SF
1989Year Built
9,015Lot SF

311 S New Hampshire Avenue is a sixteen-unit apartment building in Koreatown, built in 1989 on a 9,015 SF lot between 3rd Street and Wilshire Boulevard. The county carries the three-story wood-frame building at 11,792 SF over a secured subterranean garage. The plan is eight 1 bed / 1 bath units of about 600 SF and eight 2 bed / 2 bath units of about 850 SF, with balconies on the upper floors, an on-site laundry room and, as of August 2026, four permitted EV chargers.

Scheduled income is $32,203 per month on ownership's rent roll dated September 8, 2026, with units 103, 202 and 204 vacant and carried at ownership's projected rents of $1,895, $1,895 and $2,398. Thirteen units are occupied at $1,454 to $2,500; eight of those tenancies began between 2008 and 2017, unit 201 was just leased at $2,398, and the newest one-bedroom lease (March 2025) is at $1,998. Parking at the scheduled $1,405 per month, laundry and utility reimbursement add $42,939 per year on 2025 actuals.

At the recommended $3.85M the property prices at $240,625 per unit and $326 per SF, a 6.50% return on current scheduled income after ownership's 2025 actual expenses and 7.18% at pro forma rents. Seven closed sales of 1988 to 1991 buildings within a mile and a half frame that number at $225,000 to $270,000 per unit and $256 to $424 per SF; the subject sits in the middle on both, and 1.9% below the $3,925,000 ask that did not produce a sale between March and August 2026.

The right buyer values what is scarce here: a Koreatown building outside the RSO with a 6.5% going-in yield on real 2025 expenses and eight long-term tenancies that reset to market on turnover. That buyer should be qualified early on two questions, whether they will underwrite the three vacancies at ownership's projected rents or at collections, and whether they will re-trade after inspection of the eleven original interiors, because both decide whether an offer survives to closing.

311 S New Hampshire

Investment Highlights

  • Built 1989: exempt from the Los Angeles Rent Stabilization Ordinance, subject only to the statewide AB 1482 cap, with rents resetting to market on turnover
  • Sixteen units in a balanced plan: eight 1 bed / 1 bath and eight 2 bed / 2 bath, five of them remodeled
  • 6.50% cap rate and 9.96 GRM on current scheduled income and ownership's 2025 actual expenses at the recommended price, 7.18% at pro forma rents
  • $32,203 per month scheduled on ownership's September 2026 rent roll, 13 of 16 occupied, with eight tenancies dating from 2008 to 2017 at $1,454 to $2,343
  • Secured subterranean garage, on-site laundry and four EV chargers permitted in August 2026
  • 11,792 SF on a 9,015 SF C2 lot in a federal Opportunity Zone, Walk Score 95, two blocks from the Wilshire and Vermont Metro station
Location Overview
Koreatown, Between 3rd Street and Wilshire, Two Blocks From the Metro

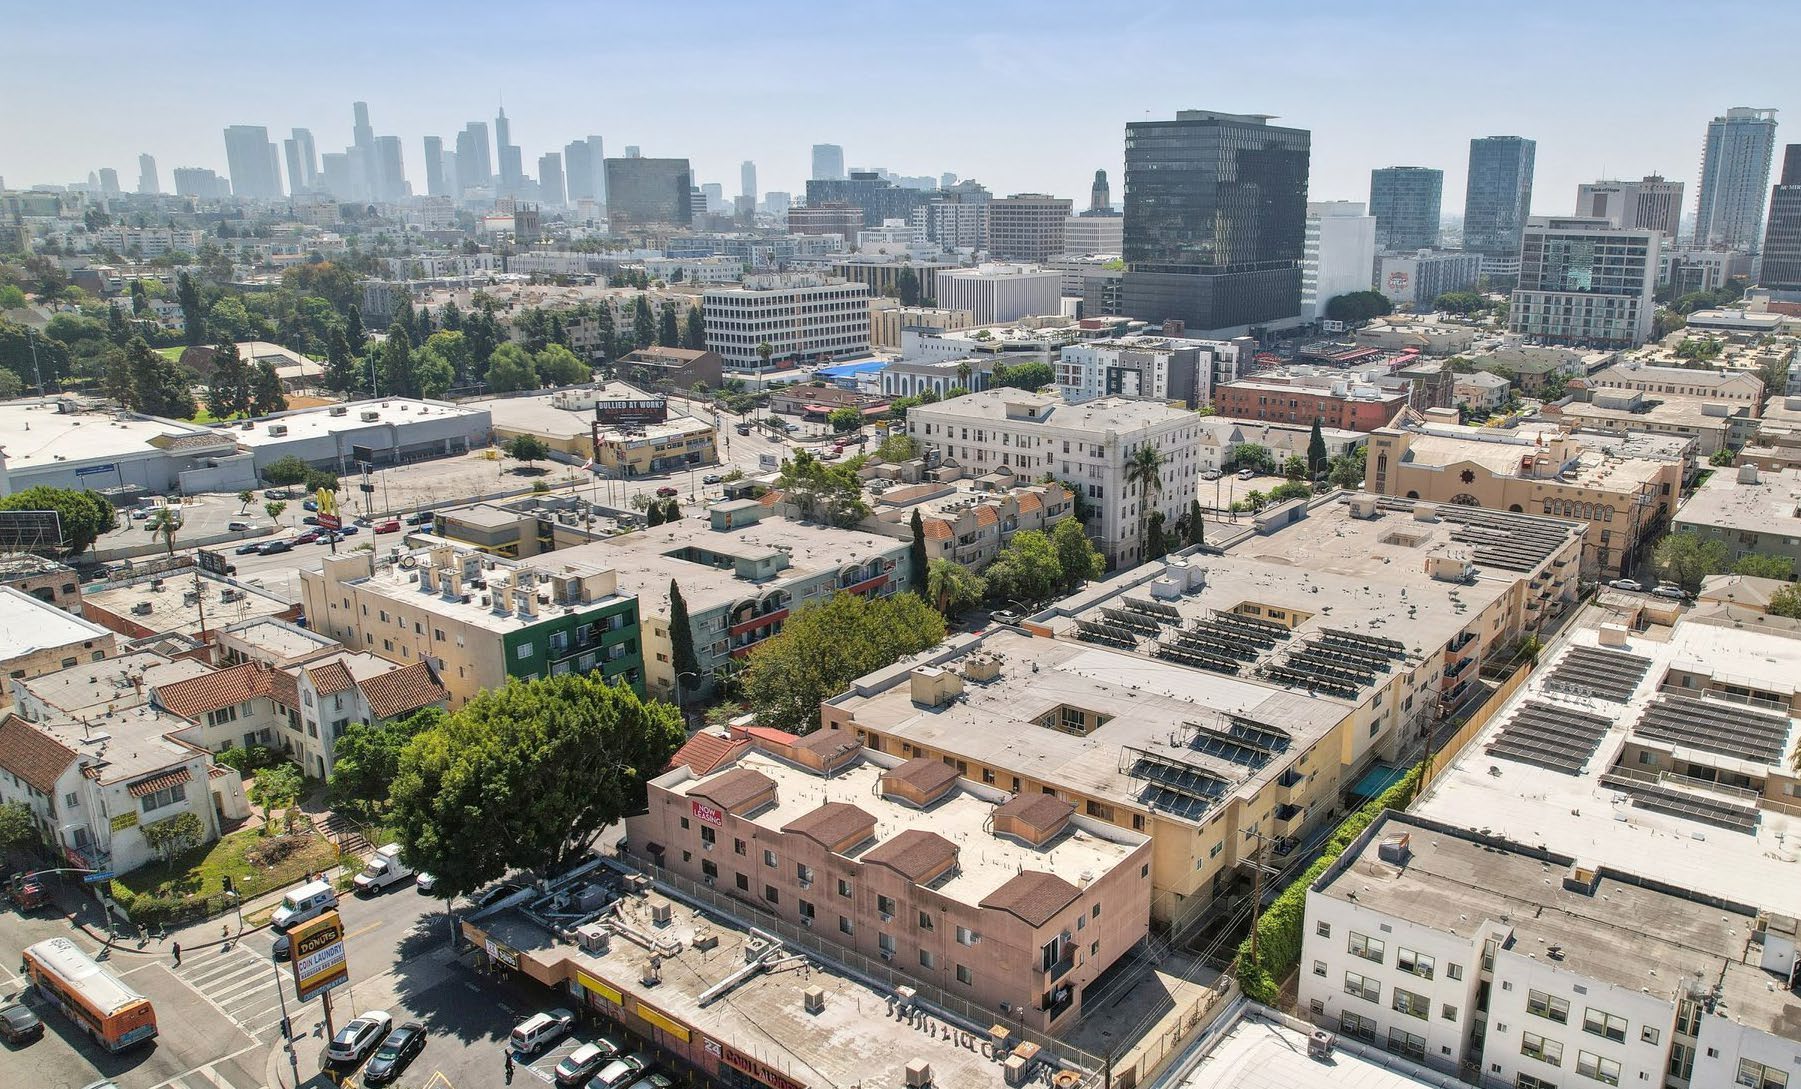
The property sits on the east side of New Hampshire Avenue between 3rd Street and 4th Street, in the Wilshire community plan area and Council District 10. The block is residential, a mix of 1920s courtyard buildings and 1960s to 1990s apartment houses, with the Wilshire corridor towers three blocks south and the Wilshire and Vermont B and D Line station a short walk east. The 101 Freeway is a mile north; downtown is ten minutes east.

The 90020 ZIP code reports 38,994 residents with a median age of 36.2, and 91% of its 17,942 occupied households rent. Median gross rent is $1,773 and vacancy runs at 7.9%. Of the ZIP's housing stock, 2,965 units were built in the 1980s and 2,074 in the 1990s against 4,190 built before 1940, so post-1978 buildings outside the RSO are the minority product. The parcel scores 95 on Walk Score, 77 on Transit Score and 66 on Bike Score, and sits in FEMA Zone X, an area of minimal flood hazard.

Koreatown is the densest rental market in Los Angeles and its buyer pool prices the RSO exemption directly: the seven same-vintage buildings that traded within a mile and a half since February 2025 all closed, at $225,000 to $270,000 per unit, while older stock in the same blocks trades on a different basis. A buyer here is choosing among a small set of post-1978 buildings, and only one of them is on the market today.

Property & Location Details
Address311 S New Hampshire Avenue, Los Angeles, CA 90020
CityLos Angeles, CA 90020
APN5502-007-014
Year Built1989
Building SF11,792
Lot Size9,015 SF (0.207 ac)
Units16
ParkingSecured subterranean garage; the prior listing materials carry 22 spaces and ownership's rent roll schedules $1,405 per month of parking rent. Four EV chargers were permitted and finaled in August 2026. Verify the space count and assignment during inspection.
Location Map
Property Details
311 S New Hampshire
Property Overview
Units16
Year Built1989
Building SF11,792
Lot SF9,015
APN5502-007-014
Unit Mix
8x 1 Bed / 1 Bath600 (est.) SF
8x 2 Bed / 2 Bath850 (est.) SF

The building is three stories of wood frame over a subterranean garage, 11,792 SF per the county on a 60 by 150 foot lot, with a flat built-up roof replaced under permit in 2009 (38 squares) and earthquake gas shut-off valves installed in 2004. It is not in the City's soft-story retrofit program. Four EV chargers and a gateway were added to the existing electrical service under permits issued August 14, 2026 and finaled August 28, 2026.

Interiors in the remodeled units show white shaker cabinetry with granite counters, grey plank flooring, stainless or black appliances, tub-and-shower baths with black fixtures, wall air conditioning and, on the upper floors, private balconies. Unit sizes are approximate: about 600 SF for the one bedrooms and 850 SF for the two bedrooms per the prior offering; the portal listings show larger figures that would exceed the assessed area, so the smaller figures are carried and labelled as approximate throughout. Price per square foot on this analysis uses the 11,792 SF county total. The prior listings carry 22 garage spaces.

A 1989 building carries the systems of its era, and ownership's statements show what that costs: $25,737 of repairs in 2025 (partly a turnover year, with $17,706 more spent on remodels and capital items below the line), water and sewer at $31,073, and a roof now seventeen years into its life. Five of the sixteen units have been remodeled; the other eleven are the turnover opportunity and the capital plan at once. This analysis carries repairs at $1,250 per unit and reserves at $250 per unit, and a buyer should verify condition, systems and the remaining original interiors through inspection.

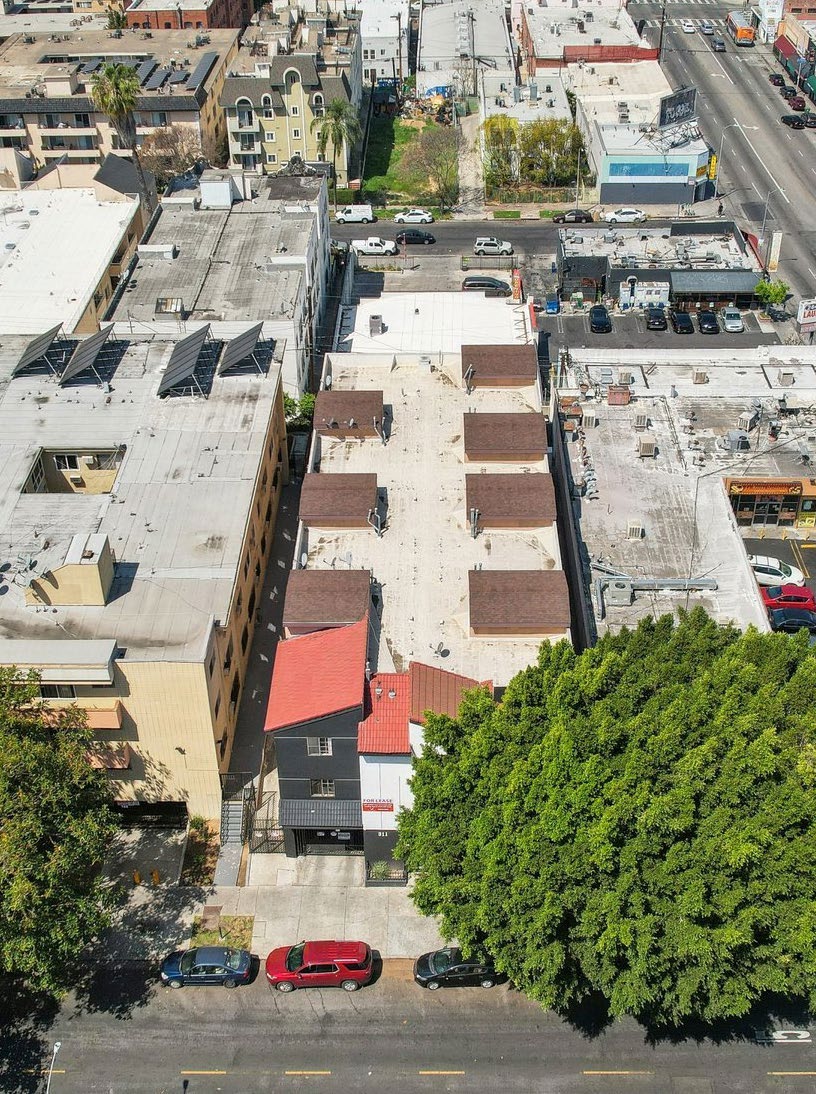
Property Photos
311 S New Hampshire
1 / 14 311 S New Hampshire photo
Aerial

Click any image to enlarge. Images depict the property and representative interiors. Source: listing media and site photography.

Rent Comparables
Achieved and Asking Rents in the Immediate Submarket
Rent Comps Map

One Bedroom Comparables

AddressUnit TypeSFAsking RentDistance
2816 S Westlake Ave, Los Angeles1 Bed / 1 Bath-$2,2921.40 mi
3601 N Normandie Ave, Los Angeles1 Bed / 1 Bath-$2,2001.01 mi
4810 S Berendo St, Los Angeles1 Bed / 1 Bath-$1,2450.78 mi
5Wilshire Alexandria Westgate, 535 S Alexandria Ave, Los Angeles1 Bed / 1 Bath-$1,9300.41 mi
6Wilshire Hobart Ambassador, 410-430 S Hobart Blvd, Los Angeles1 Bed / 1 Bath-$1,8500.68 mi
7526 Ardmore, 526 S Ardmore Ave, Los Angeles1 Bed / 1 Bath-$1,8000.53 mi
8Victoria Apartments, 414-444 S Ardmore Ave, Los Angeles1 Bed / 1 Bath-$1,8500.48 mi
9Parc Meridien, 510 S Normandie Ave, Los Angeles1 Bed / 1 Bath-$1,9950.46 mi
Average (8 comps)-$1,8950.72 mi

Two Bedroom Comparables

AddressUnit TypeSFAsking RentDistance
1542 N Normandie Ave, Los Angeles2 Bed / 2 Bath-$2,4000.89 mi
2816 S Westlake Ave, Los Angeles2 Bed / 2 Bath-$2,6751.40 mi
4810 S Berendo St, Los Angeles2 Bed / 2 Bath-$2,1870.78 mi
5Wilshire Alexandria Westgate, 535 S Alexandria Ave, Los Angeles2 Bed / 2 Bath-$2,7500.41 mi
6Wilshire Hobart Ambassador, 410-430 S Hobart Blvd, Los Angeles2 Bed / 2 Bath-$2,4500.68 mi
7526 Ardmore, 526 S Ardmore Ave, Los Angeles2 Bed / 2 Bath-$2,3500.53 mi
8Victoria Apartments, 414-444 S Ardmore Ave, Los Angeles2 Bed / 2 Bath-$2,2500.48 mi
Average (7 comps)-$2,4370.74 mi

Rent evidence is read plan by plan. One bedrooms at the large 1960s and 1970s communities within half a mile ask $1,800 to $1,995; in-place one bedrooms on same-vintage buildings that recently sold run $2,200 (renovated, 601 N Normandie) and $2,292 (816 S Westlake); ownership projects its two vacant one bedrooms at $1,895 and advertises them with a six-month concession to $1,595. Two bedrooms at the competing communities ask $2,250 to $2,750; in-place two-bath units on same-vintage buildings run $2,400 (542 N Normandie) and $2,675 (816 S Westlake); ownership just leased unit 201 at $2,398 and projects the vacant unit 204 at the same figure.

The pro forma therefore carries $1,895 for the one bedrooms and $2,398 for the two bedrooms, ownership's own projected and newly achieved rents, a 7.3% lift to $414,588. That is deliberately below the prior offering's $1,995 and $2,575, because ownership is leasing below those figures today, and it holds the two newest leases (unit 205 at $2,500 and unit 208 at $1,998) at their current rents. The upside in this building is in the eight tenancies from 2008 to 2017, not in the newest leases, and a buyer will price it that way.

Sale Comparables
7 Closed Sales in the Submarket
Sale Comps Map
AddressYrUnitsBldg SFSale Price$/Unit$/SFGRMCapDate
1534 S Oxford Ave, Los Angeles19892114,787$5,041,000$240,048$341--2025-08-22
2843 S Ardmore Ave, Los Angeles19891513,095$3,550,000$236,667$271--2025-07-25
3542 N Normandie Ave, Los Angeles19881211,700$3,000,000$250,000$2568.68-2026-03-31
4601 N Normandie Ave, Los Angeles199095,724$2,425,000$269,444$42410.21-2026-03-10
5646 N Madison Ave, Los Angeles1988107,134$2,300,000$230,000$322--2026-05-21
6976 Elden Ave, Los Angeles19902017,544$4,500,000$225,000$25612.403.81%2025-07-01
7816 S Westlake Ave, Los Angeles19901815,068$4,860,000$270,000$3238.837.12%2025-02-05
Median (7 comps)13,095$3,550,000$240,048$3229.525.46%-

Seven closed sales of 1988 to 1991 apartment buildings within a mile and a half of the subject recorded between February 2025 and May 2026. They closed at $2,300,000 to $5,041,000, $225,000 to $270,000 per unit and $256 to $424 per SF. The nearest and largest, 534 S Oxford Ave, a 21-unit 1989 building five blocks west, recorded at $5,041,000 in August 2025 ($240,048 per unit, $341 per SF); the most recent, 542 N Normandie Ave, twelve 2 bed / 2 bath units of 1988 vintage, recorded at $3,000,000 in March 2026 after listing at $3,550,000.

The pattern across the set is the same: every listed building closed below its ask, by 5.6% to 17.9%, after 57 to 321 days. The subject has lived that pattern itself, listed by KW Commercial in December 2024, by the Ghobaditey Team in April 2025 at a 5.83% cap, and by RE/MAX from March 2026 at $3,925,000, each without a sale. The one active same-vintage listing, 810 S Berendo, asks $264,706 per unit and $353 per SF at 5.26% on in-place rents and has been on the market a month. The subject at $3.85M is $240,625 per unit and $326 per SF, below that ask on both measures and inside the closed range on both.

1. 534 S Oxford Ave, Los Angeles - Same vintage, same ZIP, closest physical match in the set and the largest closed print; nine tenths of a mile from the subject. Three-story 21-unit building of 1989 vintage, 14,787 SF on an 8,739 SF R4 lot, five blocks west of the subject in the same 90020 ZIP. Marketed by CBRE; no income published in the retrieved record. Previously sold March 2020 at $4,770,000, so the 2025 print is 5.7% above the 2020 basis.

2. 843 S Ardmore Ave, Los Angeles - Same vintage and a mixed one- and two-bedroom plan like the subject; the closest match on unit mix. Three-story 15-unit building of 1989 vintage: nine 1 bed / 1 bath, five 2 bed / 2 bath and one 2 bed / 1 bath; 13,095 SF per the assessor (the listing printed 8,100 SF). Listed 2024-09-07 at $3,995,000 by Hatkoff Investments and closed 11.1% below the ask after ten months of exposure.

3. 542 N Normandie Ave, Los Angeles - Same vintage and building size, all two-bedroom, two-bath units like the subject's larger plan; the most recent closed print on a 1980s building. Three-story 12-unit building of 1988 vintage, all 2 bed / 2 bath of about 975 SF, 11,700 SF on a 9,148 SF R3 lot. Listed 2025-09-30 at $3,550,000 by Keller Williams VIP at an average rent of $2,400 ($345,600 per year), 100% occupied, and closed 15.5% below the ask.

4. 601 N Normandie Ave, Los Angeles - Smaller all-one-bedroom building in East Hollywood; useful for the one-bedroom rent and the per-unit ceiling on renovated product, less so on scale. Nine renovated 1 bed / 1 bath units of 1990 vintage, 5,724 SF, 12 assigned parking spaces; $550,000 of 2019 renovations including plumbing, electrical, sprinklers and roof. Listed 2026-01-12 at $2,600,000 by Real Broker with every unit at $2,200 and closed 6.7% below the ask in 57 days.

5. 646 N Madison Ave, Los Angeles - Same vintage and a similar one- and two-bedroom plan on a smaller building in East Hollywood; deep below-market rents limit the income read. Ten-unit building of 1988 vintage (the assessor carries nine): four 1 bed / 1 bath and six 2 bed / 1 bath, 7,134 SF, 21 ground-level gated spaces, coin laundry. Opportunity Zone, TOC Tier 3. Listed at $2,249,000 by Lyon Stahl with roughly 60% rental upside claimed and closed 2.3% above the ask.

6. 976 Elden Ave, Los Angeles - Same vintage and a two-bedroom, two-bath plan like the subject's; the largest income-published print, with rents far below market that explain its 3.8% cap. Twenty-unit building of 1990 vintage: sixteen 2 bed / 2 bath and four 1 bed / 1 bath, 17,544 SF on a 17,105 SF lot with 20 parking spaces. Listed 2025-03-19 at $5,480,000 by IRN Realty on $362,786 of gross scheduled income and $171,514 of net operating income (rents averaging about $1,560 for the two bedrooms) and closed 17.9% below the ask in 104 days. The MLS closing record shows $4,550,000; the deed-derived $4,500,000 is carried.

7. 816 S Westlake Ave, Los Angeles - Same vintage and plan with rents already at market; the Westlake location a mile and a half southeast is a lesser submarket than Koreatown. Eighteen-unit building of 1990 vintage: six 1 bed / 1 bath at $2,292 and twelve 2 bed / 2 bath at $2,675, 15,068 SF, 19 covered spaces, elevator, subterranean parking with security access. Listed at $5,150,000 by Marcus & Millichap on $550,224 of gross income and $346,020 of net operating income and closed 5.6% below the ask; rents were at market, so the 7.1% cap is a stabilized yield.

Opinion of Value
Suggested List Price and Expected Sale Range
BasisPrice$/Unit$/SFGRM CurrentGRM Pro FormaCap CurrentCap Pro Forma
Suggested list price$3,850,000$240,625$326.499.969.296.50%7.18%
Range top$3,850,000$240,625$326.499.969.296.50%7.18%
Midpoint$3,750,000$234,375$318.019.709.056.70%7.40%
Range bottom$3,650,000$228,125$309.539.458.806.92%7.64%

Property taxes reassess at the sale price, so the net operating income and therefore the capitalization rate are recalculated at every rung above.

On-Market Comparables
Active Competition and the Pricing Ceiling
On-Market Comps Map

Side by Side: 311 S New Hampshire vs 810 S Berendo St, Los Angeles

311 S New Hampshire810 S Berendo St, Los Angeles
List Price$3,850,000$4,500,000
Price per Unit$240,625$264,706
Price per SF$326.49$353.02
Cap Rate6.50%5.26%
GRM9.9611.22
Units1617
Year Built19891991
Building SF11,79212,747

810 S Berendo St, Los Angeles - The only active post-1978 listing in Koreatown; eight tenths of a mile south of the subject and larger by one unit. An asking price, so a ceiling rather than proof of value. Four-story 17-unit building of 1991 vintage: thirteen 2 bed / 2 bath and four 1 bed / 1 bath, 12,747 SF, 24 subterranean spaces, elevator, central air, separately metered gas and electric.

Financial Analysis
311 S New Hampshire

Unit Mix & Scheduled Rent

UnitTypeApprox SFStatusCurrent RentMarket Rent
1012 Bed / 2 Bath850 (est.)Occupied$2,343$2,398
1021 Bed / 1 Bath600 (est.)Occupied$1,454$1,895
1031 Bed / 1 Bath600 (est.)Vacant$1,895$1,895
1042 Bed / 2 Bath850 (est.)Occupied$2,343$2,398
1052 Bed / 2 Bath850 (est.)Occupied$2,334$2,398
1062 Bed / 2 Bath850 (est.)Occupied$2,181$2,398
1071 Bed / 1 Bath600 (est.)Occupied$1,454$1,895
1081 Bed / 1 Bath600 (est.)Occupied$1,575$1,895
2012 Bed / 2 Bath850 (est.)Occupied$2,398$2,398
2021 Bed / 1 Bath600 (est.)Vacant$1,895$1,895
2031 Bed / 1 Bath600 (est.)Occupied$1,616$1,895
2042 Bed / 2 Bath850 (est.)Vacant$2,398$2,398
2052 Bed / 2 Bath850 (est.)Occupied$2,500$2,500
2062 Bed / 2 Bath850 (est.)Occupied$2,205$2,398
2071 Bed / 1 Bath600 (est.)Occupied$1,616$1,895
2081 Bed / 1 Bath600 (est.)Occupied$1,998$1,998
Total Scheduled Rent$32,203$34,549
Additional Income[1]$3,578$3,578
Monthly Scheduled Gross Income$35,781$38,127

3 of 16 units convey vacant and carry the asking rent in the Current Rent column; occupied units carry their in-place rent.

Annualized Operating Data

 CurrentMarket
Scheduled Gross Income[2]$429,375$457,527
Vacancy Reserve at 2.7%[3]($11,593)($12,438)
Gross Operating Income$417,782$445,089
Operating Expenses($167,711)($168,804)
Net Operating Income$250,071$276,285
Loan Payments (Illustrative)($184,900)($184,900)
Pre-Tax Cash Flow (Illustrative)$65,171$91,385
Principal Reduction (Illustrative)$29,324$31,210
Total Return Before Taxes$94,495$122,595

Annualized Expenses

 CurrentPro Forma
Real Estate Taxes[4]$47,613$47,613
Insurance[5]$14,992$14,992
Utilities[6]$36,344$36,344
Trash Removal[7]$13,718$13,718
Repairs & Maintenance[8]$20,000$20,000
Contracted Services[9]$7,033$7,033
On-Site Manager[10]$4,800$4,800
General & Administrative[11]$2,500$2,500
Replacement Reserves[12]$4,000$4,000
Management Fee (4.0% of EGI)[13]$16,711$17,804
Total Operating Expenses$167,711$168,804
Expense Ratio40.1%37.9%
Per Unit$10,482$10,550
Per Square Foot$14.22$14.32

Notes to the Operating Statement

[1] Additional Income: Parking at the $1,405 per month scheduled on the rent roll ($16,860), laundry at the 2025 actual ($2,926) and utility reimbursement at the 2025 actual ($23,153), $42,939 in total. Parking collections were $19,453 in 2025 and are running $21,487 annualized in 2026, and utility reimbursement is running $33,333 annualized in 2026; both are treated as upside. Late, application and NSF fees are not carried.

[2] Scheduled Gross Income: Sixteen units at the rents on ownership's rent roll dated September 8, 2026, $32,203 per month, with units 103, 202 and 204 shown vacant and carried at the projected rents ownership prints for them ($1,895, $1,895 and $2,398), standard Los Angeles practice. The market column carries $1,895 for the one bedrooms and $2,398 for the two bedrooms, the rents ownership is projecting and just achieved on unit 201, with units 205 ($2,500) and 208 ($1,998) held at their higher current rents.

[3] Vacancy Reserve: 3.0% of scheduled gross rent, the LAAA floor for a conventional whole-unit building. Three of sixteen units are vacant today and 2025 collections ran about 10% below scheduled rent, so a buyer may carry 5%; the difference is about $7,400 of net operating income.

[4] Real Estate Taxes: Reassessed at the recommended list price of $3,850,000 at the 1.2367% effective rate derived from the subject's own 2025 bill of $48,192 on $3,896,754 of assessed value, tax rate area 0-067, or $47,613 per year. Ownership booked $47,892 in 2025.

[5] Insurance: LAAA allowance of $200 per unit plus $1.00 per gross SF, $14,992. Ownership booked $6,713 in 2025 and nothing through July 2026, which is not a premium a buyer can obtain on a 16-unit Koreatown building.

[6] Utilities: Calendar 2025 actuals of $36,344: water and sewer $31,073, electric $4,102, telephone $733 and gas $436. The $23,153 of utility reimbursement on the income side recovers about two thirds of it.

[7] Trash Removal: $13,718 as booked in 2025, $857 per unit.

[8] Repairs & Maintenance: $1,250 per unit per year, $20,000, for a 1989 building. Ownership booked $25,737 in 2025 (net $23,070 after tenant reimbursements) and $10,591 through July 2026 (net $12,370 annualized); the allowance sits between the two years.

[9] Contracted Services: Pest control, gardening and janitorial at $7,033 as booked in 2025.

[10] On-Site Manager: $400 per month to the resident key holder, $4,800, as booked.

[11] General & Administrative: $2,500 allowance against $2,024 of licenses, permits and auto booked in 2025. The $9,134 of 2025 marketing is treated as a turnover cost and the $2,000 of 2026 legal fees as non-recurring.

[12] Replacement Reserves: $250 per unit per year, $4,000. Ownership spent $17,706 on capital items in 2025 and $10,148 through July 2026 below the operating line, mostly turnover remodels.

[13] Management Fee (4.0% of EGI): 4.0% of effective gross income, $16,711 on current income and $17,804 pro forma. Ownership booked $18,783 of off-site management in 2025, about 4.8% of collected income, plus the on-site key holder.

Owner-reported figures are unaudited. A buyer should verify all income and expenses in due diligence.

Summary
Operating Data
Price$3,850,000
Number of Units16
Price per Unit$240,625
Price per SF$326.49
Current GRM9.96
Market GRM9.29
Current Cap Rate6.50%
Market Cap Rate7.18%
Cash-on-Cash Return (Current)4.84%
Cash-on-Cash Return (Market)6.78%
Proposed Financing (Illustrative)
Loan Amount$2,502,500
Down Payment$1,347,500
Interest Rate6.25%
Amortization30 years
DCR1.35

Illustrative financing assumption. Not a quoted or committed loan. A buyer should obtain its own terms.

The recommended list price is $3.85M, at the top of an opinion-of-value range of $3.65M to $3.85M. Current scheduled income of $386,436 less a 3% vacancy reserve plus $42,939 of parking, laundry and utility reimbursement gives $417,782 of effective gross income; operating expenses of $167,711, built from ownership's 2025 actuals with taxes reassessed at the list price, produce net operating income of $250,071, a 6.50% cap rate and a 9.96 gross rent multiplier. At pro forma rents of $414,588 the net operating income is $276,285 and the cap rate 7.18%. The price is $240,625 per unit and $326 per SF.

Against the evidence, the price is disciplined rather than aggressive. It sits inside the closed per-unit and per-square-foot ranges, below the one active same-vintage ask, and at a yield between the fully stabilized Westlake sale and the Berendo asking price. The reasons it is not higher are the same reasons it is defensible: six months of exposure at $3,925,000 without a sale, three vacancies being filled with concessions, a water bill above $31,000, and eleven original interiors. A buyer who accepts ownership's projected rents on the vacant units will pay the top of the range; a buyer who underwrites to 2025 collections will pay the bottom.

Recommended List Price
$3,850,000

Supported value range: $3,650,000 to $3,850,000

Disclosures

Scheduled income is ownership's rent roll dated September 8, 2026, with units 103, 202 and 204 vacant at ownership's projected rents of $1,895, $1,895 and $2,398. Parking is carried at the roll's $1,405 per month schedule; laundry and utility reimbursement are calendar 2025 actuals. Calendar 2025 rental income collected was $345,971 and January through July 2026 collections were $209,533. Taxes are reassessed at the list price at the subject's own 1.2367% effective rate. Utilities ($36,344), trash ($13,718), contracted services ($7,033) and the on-site key holder ($4,800) are ownership's 2025 actuals; insurance ($14,992 against $6,713 booked), repairs ($20,000 against $25,737 booked), reserves ($4,000) and management (4% of effective gross income against $18,783 booked) are LAAA allowances. Marketing of $9,134 in 2025 and legal fees of $2,000 in 2026 are treated as non-recurring. Debt figures are illustrative: a new loan at 65% loan to value, $2,502,500 at 6.25% on a 30-year amortization, not a lender quote.

Ownership's statements print year-to-date totals without monthly detail. Unit square footages are approximate and are the prior offering's figures. Comparable cap rates and multipliers are as published by the listing brokerages and were not independently audited; two closed comparables published no income and are presented on price per unit and per square foot only. The property was listed by KW Commercial from December 2024, by the Ghobaditey Team from April 2025 and by RE/MAX Commercial from March 2026 at $3,925,000; all three listings show as no longer advertised as of September 4, 2026.